
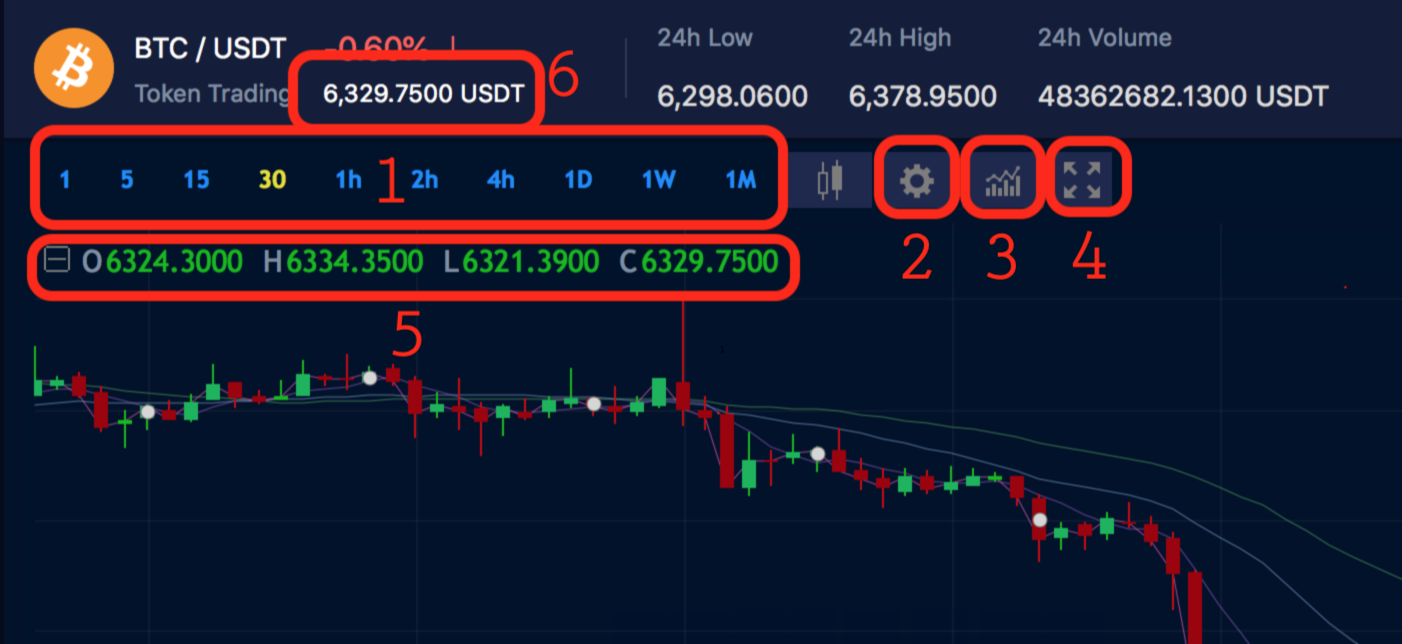
- Candle interval selection. e.g. 1h means each red/green candle represents 1 hour.
- Chart properties allow color changes, scale parameters change etc.
- Open a large database of additional chart indicators.
- Expand the chart to fill the screen.
- Open (O), High (H), Low (L), and Close (C) price for selected candle.
- Current Market Price
Comments
0 comments
Please sign in to leave a comment.